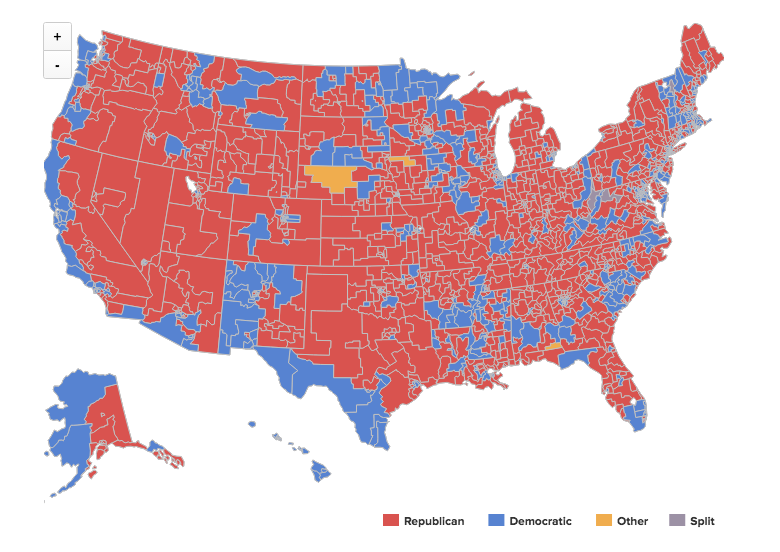
As an experiment in mapping, I found Census shape files for the upper and lower legislative boundaries in all 50 states and combined them into one U.S. map. Then, using FiscalNote data, I was able to plot the representative of each district according to their party.
Several states had datasets that required some finesse. Most label districts by an ID number, while others actually have names for the districts with corresponding abbreviations. Also in this project I used some Python to move Alaska and Hawaii and iterated and iterated to smooth out some lines to they were at least somewhat compact.